
14.07.2009 | Frederik Ramm
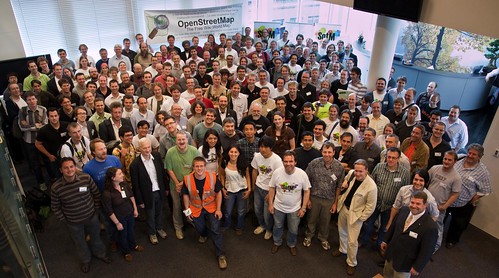
Am Sonntag ging in Amsterdam die diesjährige “State of the Map” zu Ende, die jährliche internationale OpenStreetMap-Konferenz. Über 200 Teilnehmer waren nach Holland gereist, um sich insgesamt über 70 Vorträge anzuhören und nebenher natürlich zu “networken” und sich abends bei einem Bier oder anderen Genussmitteln zu unterhalten.
Die Konferenz war aufgeteilt in einen “Pro Users Day” am Freitag und die Community-Konferenz am Samstag/Sonntag, allerdings war die Trennung nicht besonders strikt, und an allen drei Tagen kamen sowohl Mapper als auch gewerbliche OSM-Nutzer zu Wort. Wir selbst (Jochen und Frederik) haben insgesamt 6 Vorträge gehalten und uns ansonsten bemüht, nicht allzuviel zu verpassen. Trotzdem konnten wir nicht alles sehen, und der nun folgende Bericht enthält nur, was wir bemerkenswert fanden.
Sehr interessant war der Vortrag von Muki Haklay vom University College London über die Qualität von OSM in Großbritannien. Der Vergleich mit dem leicht generalisierten Ordnance Survey-Datensatz “Meridian 2” und der nicht generalisierten “Master Map” zeigte, dass die Abweichungen zwischen OSM und der “Master Map” geringer sind als die zwischen OSM und “Meridian 2”, und OSM daher deutlich besser ist als das preiswertere der beiden OS-Produkte. Zugleich stellte Haklay aber auch fest, dass abseits der Städte oft nur sehr wenige Mapper sich um einen Bereich kümmern, und auch die innerstädtische Qualität in bestimmten Gegenden deutlich schlechter ist als in anderen. Es wäre spannend, einige von Haklays Analysen automatisiert regelmäßig stattfinden zu lassen.
Qualität war überhaupt ein wichtiges Thema auf der SOTM; auch Jochen referierte darüber, und Steven Feldman untersuchte, ob das mit OSM so weitergehen kann, oder ob wir uns irgendwann verheddern, weil niemand mehr Daten aktualisiert. Er kam zu dem Fazit, dass die Faktoren, die die Mapper motivieren, dafür sorgen werden, dass OSM durchaus nachhaltig ist – also Entwarnung in dieser Frage.
Der geplante Lizenzwechsel wurde öfters angesprochen und war auch Thema einer einstündigen Veranstaltung, bei der nach einer kurzen Präsentation durch Mike Collinson von der OSM Foundation und Jordan Hatcher, dem Kopf hinter der Open Database License, Fragen an die Mitglieder der Lizenz-Arbeitsgruppe gerichtet werden konnten. Für eine inhaltliche Diskussion war das Forum allerdings zu groß.
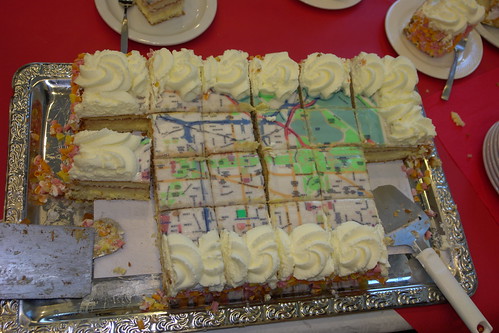
Die Veranstaltung fand übrigens in einem zentral gelegenen Konferenzzentrum der Stadt Amsterdam statt. Das Catering – Mittagessen und Kaffeepausen – kam ebenfalls von der Stadt; die meiste Arbeit wurde von einer Gruppe Auszubildender gemacht, die die Stadt nach erfolgreicher Ausbildung in die Gastronomie vermittelt. Am Samstag abend gab es ein großes gemeinsames Abendessen für alle in einem nahe gelegenen chinesischen Restaurant, inklusive eines Gedicht-Wettbewerbs, bei dem sich unverzagte Mapper darin versuchten, Haikus über OpenStreetMap zu verfassen:
The old waterway=pond;
A frog jumps in —
The sound of the natural=water.
Harry Wood referierte unter dem Titel “Community Smoothness” (eine Anspielung auf ausufernde Diskussionen im Rahmen der Einführung des Tags “Smoothness” für die Oberflächenbeschaffenheit von Wegen) über die Art, wie bei OpenStreetMap Entscheidungen, besonders bezüglich des Taggings, getroffen werden. Er verwies auf einige interessante Ansätze abseits einfacher Abstimmungen, wie zum Beispiel das “Tags I Use”-Konzept, bei dem jeder beschreibt, welche Tags er verwendet, oder Tagstat, bei dem statistische Auswertungen über die Nutzung von Tags mit Beschreibungen und Bewertungen derselben verknüpft werden. Am Rande wurde auch das “Cheat Sheet” erwähnt, das die wichtigsten Tags und Potlatch-Befehle zusammenfasst.
Wir hörten viele Berichte über den Status von OSM in anderen Ländern, sowohl den europäischen Nachbarn als auch entlegenen Nationen wie Korea, Japan oder Kolumbien. In keinem anderen Land ist OSM so populär wie in Deutschland – in den zurückliegenden 30 Tagen wurden über 40% aller Änderungen der OSM-Daten in Deutschland vorgenommen. Dennoch wird von den viel kleineren Communities in anderen Ländern oft Beachtliches geleistet, und man ist zu Recht stolz auf das Erreichte. Ein Busrouten-Projekt in Chennai (Indien) wurde vorgestellt (offizielle Informationen von Busbetreibern gibt es dort kaum). Im Gaza-Streifen wurde mit OpenStreetMap-Technologie eine separate Public-Domain-Datenbank aufgebaut, die nun schrittweise in OSM importiert wird. Wer Palästina mappt, der muss zum Beispiel eine Antwort auf die Frage haben, wie man eine Straße taggt, die für Palästinenser Einbahnstraße ist, für Israelis aber nicht. Auch das Routing wird so von der Nationalität des Nutzers abhängig. In den USA steht OpenStreetMap nicht so gut da, wie die Datenlage es vermuten lässt. Zwar hat OpenStreetMap aufgrund des TIGER-Imports rund 70% seines Datenvolumens in den USA, aber dennoch gibt es im ganzen Land nur wenige hundert aktive Mapper. Die TIGER-Daten sind häufig sehr verbesserungsbedürftig, und es bräuchte eine größere Community, um das in absehbarer Zeit zu schaffen.
Zwei Vorträge befassten sich mit dem Thema des Mappings historischer Gegebenheiten – eine Diskussion, die auf der talk-de-Liste auch schon oft geführt wurde. Wie kann man kennzeichnen, dass ein Gebäude zu einem bestimmten Zeitpunkt errichtet, dann mehrfach umgebaut und später abgerissen wurde, und wie kann diese Information in OSM einfließen, ohne die “Brot-und-Butter-Anwendung”, das Mapping der Gegenwart, allzusehr zu stören? Hier liegen allerdings bisher keine großflächig umsetzbaren Ideen auf dem Tisch.
Richard Fairhurst berichtete von einer ganzen Anzahl kaum bekannter Funktionsmerkmale im Potlatch-Editor, der rechtzeitig zur Konferenz in der Version 1.1 erschien. POIs können nun per Drag&Drop gesetzt werden, und die Verwendung von Bildern aus openstreetphoto.org ist automatisiert. Eine Version 2.0, die das modernere Action Script 3 einsetzen wird, ist in Arbeit. In einigen Präsentationen von CloudMade-Mitarbeitern war ebenfalls die Rede von einem neuen, einfacheren Editor, der vor allem für spezialisierte Anwendungen (zum Beispiel im Sport) einsetzbar wäre, aber eine formale Ankündigung gab es nicht.
Andy Allan (von CloudMade und der OpenCycleMap) hielt einen Vortrag über fortgeschrittene Kartographie und zeigte uns damit gleichzeitig, was unsere derzeitigen Karten alles noch nicht können oder nicht richtig machen. Wir können, das war sein Fazit, von gestandenen Kartographen und einschlägiger Literatur noch viel lernen. Als positives Beispiel wurde die TopOSM-Karte erwähnt, die derzeit leider nur für den US-Bundesstaat Massachusetts verfügbar ist. Auch einige andere Vorträge befassten sich mit dem Rendering, so kündigte zum Beispiel CloudMade eine Partnerschaft mit der Cartography Ltd. an, um deren in C++ entwickelte Vektor-Rendering-Engine CartoType auf mobilen Geräten mit CloudMade-Diensten einsetzen zu können. Lulu-Ann referierte über Haptische Karten für Sehgeschädigte.
Die Firma Yahoo, der OpenStreetMap ja nach wie vor wegen der Freigabe sämtlicher Luftbilder dankbar ist, war gleich doppelt präsent. Ein Mitarbeiter der Yahoo-Tochter Flickr berichtete, mit welchen teilweise abenteuerlichen Hacks OpenStreetMap-Karten zur Georeferenzierung in Flickr eingebunden werden, und die Yahoo-Geo-Abteilung kündigte an, dass man bis 2010 alle Geodaten, an denen man selbst die Rechte hat, freigeben möchte und, wo immer möglich, selbst auf freie Daten zurückgreifen will, anstatt zuzukaufen.
Mit großen Interesse (und mit Schmunzeln) haben wir den Beitrag von James Rutter aus der GIS-Abteilung der Kreisverwaltung Surrey Heath (nahe London) verfolgt. Nach dem Motto “auch Beamte wollen Spaß bei der Arbeit haben” wird die Verwaltung dort Schritt für Schritt auf OpenStreetMap (anstelle der sonst üblichen “offiziellen” Ordnance-Survey-Produkte) umgestellt. OpenStreetMap wird hier nicht nur (dank eines eigenen Tile-Servers) benutzt, sondern auch verbessert – nach allen Regeln der Kunst mit GPS und Luftbildern, für die eigens eine Lizenz zum Abdigitalisieren gekauft wurde.
Die Firma CloudMade kündigte an, Ende des Jahres einen “Marktplatz” anbieten zu wollen, auf dem neben OpenStreetMap auch nicht-freie Datensätze von ihren Lizenzinhabern zum Verkauf angeboten werden können. Die existierenden CloudMade-Dienste waren auch in einigen Vorträgen Dritter vertreten; beispielsweise wurde die erfolgreiche Offmaps-Applikation für das iPhone vorgestellt, mit der man Karten für die Offline-Nutzung herunterladen kann. Offmaps war als Anwendung für Google Maps gestartet, musste sich dann aber wegen der Google-Nutzungsbedingungen nach einer anderen Kartenquelle umsehen.
Den Abschluss der Veranstaltung am Sonntag bildete eine Auktion, bei der Henk Hoff (Mitglied des Organisationskomitees vor Ort) alles, was nicht niet- und nagelfest war, unter den Hammer brachte und so noch einmal einen vermutlich vierstelligen Betrag an Spenden für die OSM Foundation vereinnahmte.
Insgesamt war es eine sehr gelungene Veranstaltung, wenn sie auch (mit meist nur 15minütigen Vorträgen und kaum Zeit für Fragen und Antworten) zum Teil etwas überdreht wirkte. Viele Bekannte aus den Mailinglisten trafen wir zum ersten Mal in Person. Das Wetter spielte auch ausgezeichnet mit – die Ortsansässigen versicherten uns, dass es auch im Juli keineswegs selbstverständlich sei, sein Bier abends im Freien trinken zu können!
Die Geofabrik-Vorträge auf der SOTM zusammengefasst:
Die meisten Beiträge wurden auf Video aufgezeichnet. Im OpenStreetMap-Wiki steht, welche schon fertig aufbereitet und herunterladbar sind.
7.07.2009 | Jochen Topf
The OpenStreetMap community has collected an awesome amount of data. There are many places around the world where the map shows incredible detail and we come back again and again to those places when we are showing people what OSM has accomplished. But we always had to remember where all those great places are. So we created the new web site bestofosm.org where we have put markers on the map showing all those great places. You can click on any of those markers and see a popup with information about the place. If you click on the thumbnail in those popups, the map will zoom to the place and even switch the base map to the one showing the best view of this feature.
We hope that this map can work as a sort of showcase for OSM. A place you can send your grandma to if you want to show her the power of OSM. We intend to keep adding to this map and we’d love to hear what your favourite places are.
We have four kinds of entries: Places mapped with details above and beyond the call of duty are shown with a yellow star. A magnifying glass is shown for places that have played some role in OSM history (like the Isle of Wight where the first mapping party took place). Importing data from other data sources becomes more and more important for OSM. So we show some of those places with an arrow symbol. And finally there are just some interesting places around the world that OSM has good maps for which we show with an “earth” icon.
The slippy map was created with OpenLayers, you are familiar with it from other OSM sites. The base maps are the standard OSM base maps (Mapnik, Tiles@Home), the ever popular OpenCycleMap, plus the Public Transport map from öpnvkarte.de (the last currently only has data for Europe). The data for the four icon overlays comes from four KML files (they are linked at the bottom of the page). Its pretty easy to tell OpenLayers to load KML files and make the content into icons and popups. We added some special XML elements to the KML files. They tell the application which base map and which zoom to switch to when you click on the thumbnail images. Other applications reading the KML files will just ignore those special elements.
As OSM itself, the KML overlays come under CC-BY-SA, you are welcome to take them, add them to your own website, or do other things with it. You are also welcome to take ideas and code from our Javascript files. For faster access all Javascript is minified, but if you remove the “-minified” from the names of the Javascript files, you’ll get the non-minified versions.
The site currently doesn’t work in Internet Explorer, but we didn’t want to delay the release until we have the time to debug it. If you have any idea how to fix the OpenLayers KML support for IE, please shout.
28.05.2009 | Jochen Topf
There are many questions around mapping public transport related things in OSM. Should stops be tagged on the traffic way (like the highway or railway) or next to it (say where the bus stop sign stands)? How can you tie together several platforms of one railway station? What is the relationship between a subway line, the platform where it stops and the subway entrance? How should bus lines or subway lines be tagged and what about different variants of the same line? There are many more questions like this. Upon invitation from Geofabrik some people from the German OpenStreetMap community met in Karlsruhe on May 16th 2009 to discuss these issues and make some progress. Twelve people attended this meeting, including Melchior Moos, the creator of the OSM public transport slippy map at www.öpnvkarte.de and Thomas Reincke from the public transport authority of Aachen. Of course Frederik Ramm and me were also present.
Sebastian Schwarz, a student at the Karlsruhe University of Applied Sciences, is currently doing his diploma thesis with Geofabrik on this topic. He looked into previous discussions in the OSM community as well as how other organisations have been modelling public transport data. In this workshop he presented his findings and his ideas for improvements. The discussion then ranged over many topics and I think we found good solutions for many problems. Of course many compromises needed to be done and the ideas we came up with are not the end of the discussion but just one further step. We had to keep current practice in mind and tried to make things as simple as possible but still allow the complex material to be tagged in a way useful for renderers and other uses of the data.
The main topics were:
Much more detail is available on the following Wiki pages:
Once the information has stabilized somewhat we’ll move those pages to a more “official” location.
Feel free to leave comments on the talk pages. Or discuss on the transit mailing list.
Sebastian has also worked on the OSM Inspector and added five new views that show different aspects of public transport mapping in OSM:
Suggestions on how to improve those views are welcome.
23.03.2009 | Jochen Topf
Die 2., überarbeitete und erweiterte Auflage unseres Buches “OpenStreetMap – Die freie Weltkarte nutzen und mitgestalten” ist fertig und ab sofort erhältlich.
Für die Neuauflage haben wir nahezu alle Kapitel überarbeitet und Bilder aktualisiert. Sieben Kapitel sind neu hinzugekommen, viele wurden erweitert. Insgesamt ist der Umfang des Buches um 64 Seiten angewachsen – von 288 Seiten bei der ersten Auflage auf nun 352 Seiten, 32 davon in Farbe wie schon in der 1. Auflage.
Weitere Infos unter www.openstreetmap.info.
Die wichtigsten Änderungen:
5.02.2009 | Frederik Ramm

We have added a slippy map and a map comparison view to our tools page. Yes, we know, there are some of these around already, but ours have received a lot of love in the finer detail.
The slippy map, for example, has a map grid layer that clearly shows tile coordinates and boundaries on all zoom levels, making it easy to spot rendering artifacts at tile boundaries. You can also choose to see not only the mouse cursor position, but also the current extent of the map view in degrees. The map also offers quick links to a series of other OpenStreetMap services – and when you switch from our map to, say, the map display at openstreetmap.org, the viewport will of course be retained.
The map comparison tool offers a side-by-side full-screen comparison of any two map sources, and also has a slaved cross-hair pointer for exact location of detail.
All Geofabrik tools are now linked through a drop-down in the top-right corner so that you can easily switch from the map view to the Inspector or the map comparison page – and back again – without having to zoom to the same location all the time.
We have also polished the entry page, so head over there and give it a test drive!
27.12.2008 | Frederik Ramm
(This posting refers to a high-profile, ongoing tracing activity in Germany where OSM was granted access to official aerial imagery. The remainder of the posting is in German only.)
Das bayerische Landesamt für Vermessung und Geoinformation hat OpenStreetMap Mitte Dezember Luftbilder für das Gebiet der Oberpfalz zur Verfügung gestellt und das Abdigitalisieren explizit erlaubt (Wiki-Seite). Die Hauptarbeit dabei wird von der Community getan; die Geofabrik stellt einen WMS und Serverplatz für die Bilddaten bereit und hat eine spezielle OSM Inspector-Ansicht eingerichtet, die alle Objekte verzeichnet, deren Quellenangabe auf diese Luftbilder verweist.
Eine statistische Auswertung der vorliegenden Daten zeigt deutliche Fortschritte (die Auswertung basiert auf einer Zählung der Straßenkilometer der jeweiligen Straßenklassen):

Das südlich von der Oberpfalz liegende, gleich große “Vergleichsgebiet”, das wir zu statisischen Zwecken mitbeobachten, zeigt kaum Entwicklung:

Auch in der Anzahl unterschiedlicher Benutzer, die im Gebiet aktiv sind, und in der Gesamtzahl der Nodes in den OSM-Daten der jeweiligen Region, zeigt sich die deutliche Wirkung der nun verfügbaren Luftbilder:

19.12.2008 | Jochen Topf
Since the launch of the OSM Inspector (http://tools.geofabrik.de/osmi/) at the end of October many people have used it to improve OSM data. We got lots of great feedback, have fixed many bugs, and added several new views.
In time for christmas we have some presents for OSM Inspector users:
In the last months we have added the “Boundaries” view depicting administrative boundaries between countries, districts, etc. Also there is a “Kreisgrenze” view to help German users with tagging local boundaries and an import of boundaries we are planning. Also for German users is the “Strassen NRW” view which shows road data from North Rhine-Westphalia that we received from a government agency.
To celebrate the new Inspector version we added a brand new view today: The “Tagging” view shows basic problems with tags such as misspelled keys and highlights objects tagged as to-do item or with FIXME. Try it out at http://tools.geofabrik.de/osmi/?view=tagging .
We have created a mailing list for OSM Inspector “power users” at http://lists.geofabrik.de/listinfo/osm-inspector . Sign up there if you want to receive early notification of new features, or discuss possible enhancements.
From day one it was possible to look at OSM Inspector layers from WMS clients or download the data through WFS, but we never documented this. We have now added documentation for WMS and WFS access to the wiki
at http://wiki.openstreetmap.org/wiki/OSM_Inspector/WxS . This (semi-official) API allows you to get rendered maps or the raw data from OSM Inspector layers to use in your own applications. Please read
the documentation on the wiki carefully before using this and subscribe to our mailing list to keep abreast of changes if you use this API.
21.11.2008 | Frederik Ramm
Rund 6 Monate nach Start des OpenStreetMap-GPS-Verleihprogrammes, dessen Logistik von der Geofabrik abgewickelt wird, können wir zufrieden Bilanz ziehen: 20 mal haben wir die Geräte (meistens alle 10 auf einmal) auf den Weg geschickt.
Einigen Anfragern mußten wir eine Absage erteilen, weil die Geräte schon gebucht waren, aber meistens ließ es sich irgendwie arrangieren. In einem Fall haben wir mit privaten Geräten eine Lücke füllen können, in einem anderen wurden die Geräte für einen dreistelligen Eurobetrag an einem Sonntag per Bahnkurier quer durch die Republik geschickt, um Montag früh für eine Schulaktion bereitzustehen.
“Normale” DHL-Express-Sendungen gehörten zum Standard-Repertoire, und mehr als einmal mußten wir rotieren, um DHL-Pannen auszubügeln. Unvergessen ist die Episode, als wir dringend das Paket zurück erwarteten und dann im DHL-Tracking die Meldung bekamen “Paket geht zurück an Absender, Empfänger unbekannt”. Ein Anruf beim Absender ergab, dass er sich in der Hausnummer geirrt hatte, und wir konnten den DHL-Fahrer in der Stadt abfangen und ihn überreden, das Paket doch noch herauszugeben.
Neben der Terminplanung und Versandlogistik – Pakete in Empfang nehmen, Inhalt prüfen, Geräte säubern, neue Daten aufspielen, wieder verpacken und versenden – war die schwierigste Aufgabe, zu entscheiden, ob die Interessenten wissen, wovon sie reden (“haben Sie denn schon einmal selbst gemappt?”). Eine erstaunlich große Anzahl von Interessenten hatte gar nicht vor, irgendetwas für OpenStreetMap zu machen – man wollte lediglich mal “Erfahrungen mit dem GPS sammeln” oder Geocachen. In diesen Fällen haben wir freundlich, aber bestimmt abgesagt. Teilweise haben wir Interessenten, die zwar über Enthusiasmus, aber wenig OpenStreetMap-Erfahrung verfügten, auch geeignte Kontakte in der Community vermittelt, um dem Projekt eine größere Chance auf Erfolg zu geben.
Die 20 Ausleihvorgänge waren etwa zur Hälfte für Schul- oder Hochschulprojekte (alles von der 5. Klasse bis zur Fachhochschule) und zur anderen Hälfte für Mapping-Aktionen von Mitgliedern der Community oder Jugendgruppen und anderen Vereinen (Pfadfinder, Jugendfeuerwehr, Internet-Vereine). Das Feedback war durchweg positiv, die Geräte wurden als gut und leicht handhabbar bezeichnet und haben dem harten Alltag standgehalten (ein einziges Gerät hatte einmal einen Defekt und wurde von Garmin ausgetauscht). Alle Beteiligten hatten Spaß bei der Sache. Kein Ausleihvorgang, der nicht wenigstens ein paar neue OSM-Aktive hervorgebracht hätte: So soll es sein.
Die Saison 2008 ist vorüber, für die Weihnachtszeit gibt es keine Buchungen – aber für 2009 schon erste Interessenten…
An dieser Stelle sei auch noch einmal dem Linuxhotel und der Firma B1 Systems gedankt, die OpenStreetMap den Kauf dieser 10 Geräte ermöglicht haben.
4.11.2008 | Frederik Ramm
Die Geofabrik sponsort seit knapp einem Jahr die Herstellung und den Versand der OpenStreetMap-Werbeflyer. Fast 20.000 Flyer haben wir auf Anfrage von Projektmitgliedern schon quer durch Deutschland (und in angrenzende Alpenrepubliken und Eidgenossenschaften) verschickt – in Päckchen zu 10, 100, 200 oder auch mal 500. Und da gingen sie hin:

(Einige Sonderbestellungen zu Messen/Kongressen und Lieferungen mit persönlicher Übergabe fehlen in der Liste.)
Wenn auch Du (Sie) Verwendung für ein Päckchen unserer DIN A7-Werbeflyer hast (haben): Einfach Adresse und gewünschte Stückzahl an info@geofabrik.de mailen!
28.10.2008 | Jochen Topf
Mapping the world is not quite as easy as it looks and we need tools to help us do it. We need editors to input and change the data, but we also need some ways of checking whether the data we enter is correct (and we have to figure out what “correct” is supposed to mean in the OpenStreetMap universe). Of course, we have several maps already that give us a view of the collected data. But that is not enough. The “normal” maps on openstreetmap.org can’t show us every aspect of the data. Specialist debugging maps like the maplint view and the coastline checker have been used for a long time and have proven to be useful. But they are limited by the technology they use (Maplint is based on XSLT and rather slow) or by their scope (Coastline checker does only coastlines).
We here at Geofabrik have thought about this for a long time and experimented with different approaches. Today we are launching a new tool, the “OSM Inspector”. It is, hopefully, the beginning of a series of more powerful debugging tools. The OSM Inspector is basically a specialized map viewer that shows you different views of OpenStreetMap data.
The OSM Inspector is a framework into which any number of debugging views can be plugged. We initially offer three such views:
Each of these views comprises a multitude of different layers than can be individually switched on or off, and each can be used on large and small map scales alike.
Launch the Inspector and select the Geometry view, zoom in to the area you want to check. You’ll find geometry anomalies (like self-intersecting ways) highlighted. Click an object to select it, and with another button click you’re in your favourite editor (Potlatch or JOSM) to fix the problem right away… across the three tools we’re starting with, you can individually select from more than 30 different pre-computed vector layers to help you debug an area. Whether you just want to care for your specific area and fix everything that is funny there, or whether you feel responsible for the waterways of a whole country and want to zoom in to problem spots from a high-level view, the OSM Inspector is your tool for hunting down bugs and fixing them.
To try out the OSM Inspector, point your browser at tools.geofabrik.de – no registration or installation required. Currently we only have data for Europe but we hope to cover the planet eventually. Also, OSM Inspector currently requires Firefox but we’re working on IE/Safari compatibility.
An example showing the different address view features is here:
http://tools.geofabrik.de/osmi/?view=addresses&lon=8.36302&lat=49.02880&zoom=15
Or have a look at the incredibly well-mapped Prague:
http://tools.geofabrik.de/osmi/?view=addresses&lon=14.45189&lat=50.07115&zoom=12
This is only a start, more views will follow depending on what is needed and how much time we have. Tell us what you like about the views and what you’d like to see improved. What other views do you want do see? We’d love to hear from you.