
2.01.2012 | Christine Karch
Ich habe die Zeit zwischen den Jahren genutzt und Best of OpenStreetMap um einige interessante Beispiele erweitert.
Wer Best of OpenStreetMap noch nicht kennt: Es dokumentiert Meilensteine der OpenStreetMap Entwicklung. Wir zeigen herausragende Mapping-Beispiele, wenn sie eine historische Bedeutung haben oder wenn es sich ganz einfach um besonders interessante Stellen handelt.

Besonders erwähnenswert finde ich den Mapping Trip in die Regionen Beshood und Surkhrod in der
Provinz Nangarhar. Werft auch einen Blick auf diesen durchaus informativen und interessanten Blog aus Afghanistan: Jalalalaa Good!
Gleichzeitig möchte ich diese Gelegenheit nutzen, um mich vorzustellen: Seit August 2011 bin ich Mit-Geschäftsführer-/Inhaberin der Geofabrik. Ich komme aus dem Bereich der Web-Entwicklung und werde die Geofabrik insbesondere hier verstärken. Davor habe ich 9 Jahre bei plan b und 3 Jahre bei der 1&1 gearbeitet. Der OSM Community bin ich zum größten Teil noch unbekannt. Ich hoffe aber, dass sich das im Lauf der Zeit ändert, und werde meinen Teil zum Vorankommen des Projekts beitragen.
3.10.2011 | Frederik Ramm
Our OSM Inspector web site is an important part of many a mapper’s toolbox. It has a series of, daily updated, debug views on OSM data, highlighting potential problems from invalid multipolygons over strange tagging or faulty geometries to missing address data.
The OSM Inspector, or OSMI for short, has several thematic views (like “geometry”, “tagging”, “boundaries”), each of which again supports a number of individually selectable layers that highlight a specific kind of problem. OSMI displays its results over an OSM base map, and you can select individual bug reports and get more information about them, or even download a list of errors for further processing. There’s extensive documentation on the OpenStreetMap Wiki.
Worldwide Routing View
 While most views have always shown data computed in-house at Geofabrik, one of our views, the routing view, presents data that comes from an algorithm developed by Pascal Neis of OpenRouteService fame, and is sponsored by Skobbler. The routing view attempts to highlight obstacles to routing – mostly roads that are not connected when they should be, but also duplicate roads that may lead to strange routing results.
We do not have a sponsor for running this routing view world-wide on a daily basis right now, but we have run it once for the non-Europe part of the planet, and you can try it out here:
We’ll try to update this once a week or so. (The normal, sponsored routing view for Europe with daily updates is here.)
In all, OSMI has data collected by three different toolchains; one of them works globally and feeds e.g. the tagging, multipolygon, and general geometry debug views; the other two, including the routing view toolchain, currently do Europe only and would require re-writing or more hardware to cope with the whole planet.
Potlatch
It has always been possible to access OSMI views through WMS for use in other applications, especially as a background layer in editors. Users of the popular Potlatch editor were however unable to make use of this as Potlatch does not support WMS backgrounds. We have therefore configured OSMI to serve tiles as well. (We’re using the excellent open source MapProxy for that.)
If you are using Potlatch, you can now add any or all of the following background layers:
Those marked (*), and additionally all the public transport views offered by OSMI, are currently only available for Europe. For the public transport views, use the URL components “ptri” (rail infrastructure), “ptnri” (non-rail infrastructure), “ptf” (ferries), “pts” (stops), “ptn” (network).
Note that the tiles for each view will always show all available layers at the selected zoom level; when using tiles, you cannot toggle the visibility of individual layers like you can when using OSMI through its web interface. Also, the key to colours and symbols is only available within OSMI. Therefore, even if you plan to use the tiles in your editor, it might make sense to familiarize yourself with the data presentation on OSMI first!
We hope that these changes help to further improve quality awareness and, in consequence, data quality in OSM, and we’re happy to work with potential sponsors on extending these services to support more frequent updates, additional analyses, or a wider geographical coverage.
30.11.2010 | Frederik Ramm
We are sometimes asked how we produce the files on our download server. Read this if you are one of those asking.
It is 22:30 in Central Europe, and the lights come on in the Geofabrik office. (The HDD LEDs, that is.) One of the servers, named bonne, begins downloading the collected works of mappers around the world from the last 24 hours
osmosis --rri --simc --write-xml-change 2010-11-16-22:30.osc (duration 00:01:30)
and then applies them to a locally held, full copy of the OSM database (the “planet file”).
osmosis --read-xml-change 2010-11-16-22:30.osc --read-bin current-planet.osm.pbf --apply-change --write-bin new-planet.osm.pbf compress=none (00:28:09)
The newly created planet file is transferred to another server, named hammer, where a script converts it to a simple CSV-like format (the “tbf” format) and then analyzes and converts it in several steps, creating statistics and a number of shape files. The shape files are later copied to our off-site tools server where they are used by the OSM Inspector.
But bonne, of course, doesn’t sit idle. More …
14.10.2010 | Frederik Ramm
Today we finally received our author’s copies of our brand-new English OSM book. Old news, you might say; after all, this was featured on opengeodata.org a month ago. But it took a while for the books to reach us here at Geofabrik — we’ve been told that the first batch of books had to be dispatched to the US immediately because of the high demand there!
As you probably know, Jochen and I published the first OSM book ever in spring 2008, in German; a second edition came out in 2009, and a third in 2010. The book is of course a niche product as books go — with roughly 4,000 copies sold altogether. But we’ve been getting great feedback from the community and were encouraged to do an English version basically from day one. And so we did! At first we toyed with the idea of doing the book on our own with a print-on-demand place like lulu.com but we tried a few and were unhappy with the results. It took us a while to find a proper publisher with whom we could work, but we finally found a great, if small, publisher in UIT (Cambridge, UK). Just as with the German book, we not only wrote the content, but also did the typesetting, layout, and book cover ourselves, and we are very pleased with the finished product. It looks, feels, even smells like a proper book.

We had great help from one of the old OSM hands in England, Steve Chilton, who made sure that the English version properly reflects the international aspects of OSM, and fixed up our translation. Like the German book, the English one has 384 pages, 32 of them in full colour. (The English language is a bit more concise than German, so we managed to squeeze in a few extra illustrations and examples!) It covers everything there is to know about OSM, from the origins and the community to web services, editors (with detailed descriptions of Potlatch and JOSM), how to render your own maps (including how to write Mapnik and Osmarender style sheets), and how to access OSM data through API, planet files, or diff updates.
If you’re serious about OSM, you should really get this book. (If only to prove to others that the project you’re spending half your waking life on is something serious, you know, something people write books about!)
The sad thing is, like so often with publishing, the distribution, or more specifically, amazon.com; you can order the book at bookdepository.co.uk (free shipping) and it is also in stock at amazon.co.uk, but amazon.com says it “ships in 1 to 3 weeks”. (Also, both amazon sites have the wrong cover image, reflecting an early draft.) I hope that these initial distribution problems will soon be flushed out. This is the one drawback of doing a traditionally printed book – the stuff has to be shipped from printers to wholesalers to retailers and all that takes time.
More information on the book is also at www.openstreetmap.info.
22.09.2010 | Frederik Ramm
Geofabrik has been providing the OSM community with cut-down data extracts for various continents, countries, and smaller administrative divisions for over two years now. Our downloads at download.geofabrik.de form the basis of many community projects, and we’re happy to make working with OSM data easier for so many people.
 Today we’re launching experimental downloads in a new binary format. The new “protobuf binary format” (.osm.pbf) is 30% smaller than the bzip2-compressed OSM XML, and it can be processed or extracted much faster than bzip2 files. Also, while we will continue supporting the bzip2 files for a while, we hope that we can ultimately free up some resources by dropping bz2 support, and use these resources to produce an even wider set of daily updated OSM extracts.
The protobuf binary format was developed by Scott Crosby and presented to the OSM community in April this year (wiki article with details). As the name implies, it relies on Google’s “Protocol Buffers” for its internal data representation. The format is supported by Osmosis starting with version 0.37; .osm.pbf files can be read directly by Osmosis, or converted to plain XML OSM first using a command like
osmosis --read-pbf myfile.osm.pbf --write-xml myfile.osm
The above command will run significantly faster than a bz2 decompression, and the .osm.pbf files made available by Geofabrik are 100% lossless. The format offers further compression options by stripping of metadata or minimally reducing precision, but Geofabrik extracts will remain lossless.
Not only are .osm.pbf smaller and faster to process than their bz2 counterparts; they are also likely to appear faster on the Geofabrik download site than the regular .osm.bz2 files. Everyone is encouraged to give them a try.
(Edit on 2010-11-16: Initially the command line options to use were called “read-bin” and “write-bin”, but later releases of Osmosis now use “read-pbf” and “write-pbf”.)
26.07.2010 | Frederik Ramm
OpenStreetMap WMS servers are hard to come by – because they are hard to operate. Running a WMS server always means a trade-off. You can have it render from vector data which makes it slow, or render from pre-computed raster tiles which makes intermediate zoom levels and reprojection ugly. You can use clever preprocessing but then you’re unlikely to be able to trace OSM updates quickly, or you opt for high-frequency updates but that again causes more load on your server. You can use Mapnik but the available WMS servers for that are not so good, or you can use the established UMN Map Server or Geoserver which have excellent WMS support but don’t achieve what has become the “standard” look and feel for OSM maps.

Geofabrik WMS displayed in Quantum GIS.
We think we have struck a nice balance between all these goals with our WMS server, which is available to customers immediately starting from EUR 35 per month. (We regret that we cannot make this available for free due to the cost involved for us, but will consider granting free access for OSM community projects.) The server runs from a continuously updated OSM database covering the whole world, and offers a clean Mapnik vector-based rendering in all projections and sizes. More on our product page.
At the same time, we’re making the software that runs our WMS – a special module for the Apache web server that talks directly to Mapnik – available as Open Source under the GPL license, which should allow anyone to install and run their own WMS server. There’s more on the OSM wiki.
13.07.2010 | Frederik Ramm
Wir sind zurück von der State of the Map 2010, der internationalen OpenStreetMap-Konferenz, die dieses Jahr in Girona in Spanien stattfand.
Insgesamt lässt sich beobachten, dass das Interesse von Unternehmen an der Konferenz wächst; es wurden dieses Mal grob doppelt so viel Sponsorengelder eingesammelt wie letztes Mal (verbunden allerdings auch mit grob doppelt so hohen Kosten für die Konferenz), und viele “beruflich” OSM-Interessierte waren auch das ganze Wochenende da.
Dennoch schien ein großer Teil der Anwesenden eher technisch interessiert – kaum jemand im Publikum, der sich nicht schon einmal wenigstens in irgendeinen Aspekt von OSM tiefer eingearbeitet oder sogar Software geschrieben hatte. So war dann auch das Vortragsprogramm fast weniger spannend als die zahlreichen Gespräche mit Bastlern aus der ganzen Welt, die in den (spanientypisch sehr ausgedehnten) Kaffee- und Mittagspausen oder auch im Foyer vor den Vortagssälen geführt wurden.
Auf besonderes Interesse stiessen am “Business Day”, dem Freitag, die Ankündigungen von Microsoft (bing maps soll bald einen wählbaren OSM-Layer bekommen) und Aol (Mapquest will vollständig auf OSM umstellen, für Karten und Routing, und im kommenden Jahr eine Million US-Dollar bereitstellen, um das Projekt vorallem in den USA voranzubringen).
Von der Geofabrik gab es einen Vortrag über Geschwindigkeitsoptimierung bei osm2pgsql/Mapnik-basiertem Tile-Rendering (Folien hier) sowie Kurzvorstellungen der Tirex-Software und der zum Wochenende von Dennis Luxen am KIT (Karlsruher Institut für Technologie, ehemals Universität Karlsruhe) veröffentlichten schnellen Routing-Engine für OSM-Daten (Demo-Seite bei der Geofabrik, Ankündigung auf der Mailingliste.)
Als Mitglied der “Data Working Group” bei OpenStreetMap stellte Frederik ausserdem kurz die Arbeit in diesem Gremium vor, das sich mit der Bekämpfung von Vandalismus und Urheberrechtsverletzungen bei OpenStreetMap beschäftigt.
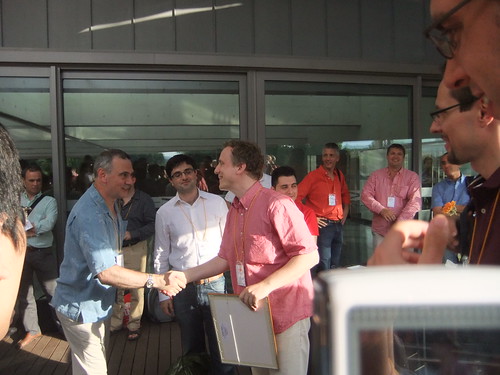
Am Freitag abend gewann die Geofabrik überraschend einen kleinen Preis für den “Best Elevator Pitch” – fünf kleinere OSM-Firmen waren aufgefordert, in einer Minute ihr Geschäftsmodell zu umreißen und zu erklären, was man macht, wer die Kunden sind, was man diesen Kunden bietet und warum sie zu einem kommen sollen. Frederik sagte für die Geofabrik in etwa folgendes:
“Unser Geschäftsmodell ist einfach, altmodisch, und langweilig: Sie zahlen uns Geld, und dafür arbeiten wir für Sie. Wir verkaufen unseren Kunden keine Software oder Leistungen, die sie nicht auch selber mit freier Software und anhand von Wiki-Anleitungen hinbekommen – wir verkaufen einfach Zeitersparnis. Die Kunden beauftragen uns, wenn sie ein Problem lieber von erfahrenen Experten lösen lassen möchten, anstatt selbst ein mehrfaches der Zeit zu investieren. Wir verwenden die Hälfte unserer Zeit darauf, mit der und für die OSM-Community zu arbeiten – dadurch weiss die Community auch, was wir können, und schickt potentielle Kunden in unsere Richtung.”
Das Publikum fand diese Beschreibung erfrischend einfach, und die Geofabrik gewann mit Abstand (“by a country mile”, wie Steven Feldman, Moderator des Wettbewerbs, sagte).
Den Abschluss der Veranstaltung bildete am Sonntag wieder, wie letztes Jahr in Amsterdam, eine langwierige Versteigerung sämtlicher übriggebliebenen Veranstaltungsgegenstände – Poster, Banner, Taschen, sogar einige Hardware und Weinflaschen wurden an den Mann oder an die Frau gebracht.
Wir hatten vier Vorab-Exemplare unseres demnächst auf englisch erscheinenden OSM-Buches dabei, die uns förmlich aus der Hand gerissen wurden (“wann kann man das kaufen? wo?…”) – nun wird es höchste Zeit, das endlich in den Handel zu bringen!
8.03.2010 | Frederik Ramm
One of the work horses behind any OpenStreetMap web map is the tile server – people either use the existing openstreetmap.org server or set up their own. The software used to run the openstreetmap.org tile server is open source, but it proved insufficient for a sophisticated tile server installation we recently did for one of our clients. This led to the development of an advanced queuing and tile rendering system we named Tirex.
 The client for whom we developed Tirex, Enaikoon GmbH in Berlin, is in the telematics business. They are OSM and Open Source friendly and allowed us to bundle the whole thing into a GPL release that is likely to benefit other users of OSM data. We have uploaded the full source code and documentation to the OpenStreetMap SVN. Details can be found on the OpenStreetMap Wiki.
18.01.2010 | Frederik Ramm
After the recent earthquake in Haiti, OpenStreetMap contributors around the world started to do what they could to improve mapping there, tracing over satellite imagery made available by GeoEye and others. Geofabrik takes part in this effort by providing a special download server that has OSM data extracts, shape files, and Garmin maps created from OSM data, all updated every five minutes in order to put mappers’ work to maximum use. We also have very large PNG files rendered every hour, and a collection of PNG map snapshots that document how mapping has progressed:


Left, OpenStreetMap map of Port-au-Prince, 1st January, 2010. Right, same map, 17th January.
Read more about the work and results of the Humanitarian OpenStreetMap Team for Haiti.
Tell us if there is something else we can do.
14.07.2009 | Frederik Ramm
Am Sonntag ging in Amsterdam die diesjährige “State of the Map” zu Ende, die jährliche internationale OpenStreetMap-Konferenz. Über 200 Teilnehmer waren nach Holland gereist, um sich insgesamt über 70 Vorträge anzuhören und nebenher natürlich zu “networken” und sich abends bei einem Bier oder anderen Genussmitteln zu unterhalten.
Die Konferenz war aufgeteilt in einen “Pro Users Day” am Freitag und die Community-Konferenz am Samstag/Sonntag, allerdings war die Trennung nicht besonders strikt, und an allen drei Tagen kamen sowohl Mapper als auch gewerbliche OSM-Nutzer zu Wort. Wir selbst (Jochen und Frederik) haben insgesamt 6 Vorträge gehalten und uns ansonsten bemüht, nicht allzuviel zu verpassen. Trotzdem konnten wir nicht alles sehen, und der nun folgende Bericht enthält nur, was wir bemerkenswert fanden.
Sehr interessant war der Vortrag von Muki Haklay vom University College London über die Qualität von OSM in Großbritannien. Der Vergleich mit dem leicht generalisierten Ordnance Survey-Datensatz “Meridian 2” und der nicht generalisierten “Master Map” zeigte, dass die Abweichungen zwischen OSM und der “Master Map” geringer sind als die zwischen OSM und “Meridian 2”, und OSM daher deutlich besser ist als das preiswertere der beiden OS-Produkte. Zugleich stellte Haklay aber auch fest, dass abseits der Städte oft nur sehr wenige Mapper sich um einen Bereich kümmern, und auch die innerstädtische Qualität in bestimmten Gegenden deutlich schlechter ist als in anderen. Es wäre spannend, einige von Haklays Analysen automatisiert regelmäßig stattfinden zu lassen.
Qualität war überhaupt ein wichtiges Thema auf der SOTM; auch Jochen referierte darüber, und Steven Feldman untersuchte, ob das mit OSM so weitergehen kann, oder ob wir uns irgendwann verheddern, weil niemand mehr Daten aktualisiert. Er kam zu dem Fazit, dass die Faktoren, die die Mapper motivieren, dafür sorgen werden, dass OSM durchaus nachhaltig ist – also Entwarnung in dieser Frage.
Der geplante Lizenzwechsel wurde öfters angesprochen und war auch Thema einer einstündigen Veranstaltung, bei der nach einer kurzen Präsentation durch Mike Collinson von der OSM Foundation und Jordan Hatcher, dem Kopf hinter der Open Database License, Fragen an die Mitglieder der Lizenz-Arbeitsgruppe gerichtet werden konnten. Für eine inhaltliche Diskussion war das Forum allerdings zu groß.
Die Veranstaltung fand übrigens in einem zentral gelegenen Konferenzzentrum der Stadt Amsterdam statt. Das Catering – Mittagessen und Kaffeepausen – kam ebenfalls von der Stadt; die meiste Arbeit wurde von einer Gruppe Auszubildender gemacht, die die Stadt nach erfolgreicher Ausbildung in die Gastronomie vermittelt. Am Samstag abend gab es ein großes gemeinsames Abendessen für alle in einem nahe gelegenen chinesischen Restaurant, inklusive eines Gedicht-Wettbewerbs, bei dem sich unverzagte Mapper darin versuchten, Haikus über OpenStreetMap zu verfassen:
The old waterway=pond;
A frog jumps in —
The sound of the natural=water.
Harry Wood referierte unter dem Titel “Community Smoothness” (eine Anspielung auf ausufernde Diskussionen im Rahmen der Einführung des Tags “Smoothness” für die Oberflächenbeschaffenheit von Wegen) über die Art, wie bei OpenStreetMap Entscheidungen, besonders bezüglich des Taggings, getroffen werden. Er verwies auf einige interessante Ansätze abseits einfacher Abstimmungen, wie zum Beispiel das “Tags I Use”-Konzept, bei dem jeder beschreibt, welche Tags er verwendet, oder Tagstat, bei dem statistische Auswertungen über die Nutzung von Tags mit Beschreibungen und Bewertungen derselben verknüpft werden. Am Rande wurde auch das “Cheat Sheet” erwähnt, das die wichtigsten Tags und Potlatch-Befehle zusammenfasst.
Wir hörten viele Berichte über den Status von OSM in anderen Ländern, sowohl den europäischen Nachbarn als auch entlegenen Nationen wie Korea, Japan oder Kolumbien. In keinem anderen Land ist OSM so populär wie in Deutschland – in den zurückliegenden 30 Tagen wurden über 40% aller Änderungen der OSM-Daten in Deutschland vorgenommen. Dennoch wird von den viel kleineren Communities in anderen Ländern oft Beachtliches geleistet, und man ist zu Recht stolz auf das Erreichte. Ein Busrouten-Projekt in Chennai (Indien) wurde vorgestellt (offizielle Informationen von Busbetreibern gibt es dort kaum). Im Gaza-Streifen wurde mit OpenStreetMap-Technologie eine separate Public-Domain-Datenbank aufgebaut, die nun schrittweise in OSM importiert wird. Wer Palästina mappt, der muss zum Beispiel eine Antwort auf die Frage haben, wie man eine Straße taggt, die für Palästinenser Einbahnstraße ist, für Israelis aber nicht. Auch das Routing wird so von der Nationalität des Nutzers abhängig. In den USA steht OpenStreetMap nicht so gut da, wie die Datenlage es vermuten lässt. Zwar hat OpenStreetMap aufgrund des TIGER-Imports rund 70% seines Datenvolumens in den USA, aber dennoch gibt es im ganzen Land nur wenige hundert aktive Mapper. Die TIGER-Daten sind häufig sehr verbesserungsbedürftig, und es bräuchte eine größere Community, um das in absehbarer Zeit zu schaffen.
Zwei Vorträge befassten sich mit dem Thema des Mappings historischer Gegebenheiten – eine Diskussion, die auf der talk-de-Liste auch schon oft geführt wurde. Wie kann man kennzeichnen, dass ein Gebäude zu einem bestimmten Zeitpunkt errichtet, dann mehrfach umgebaut und später abgerissen wurde, und wie kann diese Information in OSM einfließen, ohne die “Brot-und-Butter-Anwendung”, das Mapping der Gegenwart, allzusehr zu stören? Hier liegen allerdings bisher keine großflächig umsetzbaren Ideen auf dem Tisch.
Richard Fairhurst berichtete von einer ganzen Anzahl kaum bekannter Funktionsmerkmale im Potlatch-Editor, der rechtzeitig zur Konferenz in der Version 1.1 erschien. POIs können nun per Drag&Drop gesetzt werden, und die Verwendung von Bildern aus openstreetphoto.org ist automatisiert. Eine Version 2.0, die das modernere Action Script 3 einsetzen wird, ist in Arbeit. In einigen Präsentationen von CloudMade-Mitarbeitern war ebenfalls die Rede von einem neuen, einfacheren Editor, der vor allem für spezialisierte Anwendungen (zum Beispiel im Sport) einsetzbar wäre, aber eine formale Ankündigung gab es nicht.
Andy Allan (von CloudMade und der OpenCycleMap) hielt einen Vortrag über fortgeschrittene Kartographie und zeigte uns damit gleichzeitig, was unsere derzeitigen Karten alles noch nicht können oder nicht richtig machen. Wir können, das war sein Fazit, von gestandenen Kartographen und einschlägiger Literatur noch viel lernen. Als positives Beispiel wurde die TopOSM-Karte erwähnt, die derzeit leider nur für den US-Bundesstaat Massachusetts verfügbar ist. Auch einige andere Vorträge befassten sich mit dem Rendering, so kündigte zum Beispiel CloudMade eine Partnerschaft mit der Cartography Ltd. an, um deren in C++ entwickelte Vektor-Rendering-Engine CartoType auf mobilen Geräten mit CloudMade-Diensten einsetzen zu können. Lulu-Ann referierte über Haptische Karten für Sehgeschädigte.
Die Firma Yahoo, der OpenStreetMap ja nach wie vor wegen der Freigabe sämtlicher Luftbilder dankbar ist, war gleich doppelt präsent. Ein Mitarbeiter der Yahoo-Tochter Flickr berichtete, mit welchen teilweise abenteuerlichen Hacks OpenStreetMap-Karten zur Georeferenzierung in Flickr eingebunden werden, und die Yahoo-Geo-Abteilung kündigte an, dass man bis 2010 alle Geodaten, an denen man selbst die Rechte hat, freigeben möchte und, wo immer möglich, selbst auf freie Daten zurückgreifen will, anstatt zuzukaufen.
Mit großen Interesse (und mit Schmunzeln) haben wir den Beitrag von James Rutter aus der GIS-Abteilung der Kreisverwaltung Surrey Heath (nahe London) verfolgt. Nach dem Motto “auch Beamte wollen Spaß bei der Arbeit haben” wird die Verwaltung dort Schritt für Schritt auf OpenStreetMap (anstelle der sonst üblichen “offiziellen” Ordnance-Survey-Produkte) umgestellt. OpenStreetMap wird hier nicht nur (dank eines eigenen Tile-Servers) benutzt, sondern auch verbessert – nach allen Regeln der Kunst mit GPS und Luftbildern, für die eigens eine Lizenz zum Abdigitalisieren gekauft wurde.
Die Firma CloudMade kündigte an, Ende des Jahres einen “Marktplatz” anbieten zu wollen, auf dem neben OpenStreetMap auch nicht-freie Datensätze von ihren Lizenzinhabern zum Verkauf angeboten werden können. Die existierenden CloudMade-Dienste waren auch in einigen Vorträgen Dritter vertreten; beispielsweise wurde die erfolgreiche Offmaps-Applikation für das iPhone vorgestellt, mit der man Karten für die Offline-Nutzung herunterladen kann. Offmaps war als Anwendung für Google Maps gestartet, musste sich dann aber wegen der Google-Nutzungsbedingungen nach einer anderen Kartenquelle umsehen.
Den Abschluss der Veranstaltung am Sonntag bildete eine Auktion, bei der Henk Hoff (Mitglied des Organisationskomitees vor Ort) alles, was nicht niet- und nagelfest war, unter den Hammer brachte und so noch einmal einen vermutlich vierstelligen Betrag an Spenden für die OSM Foundation vereinnahmte.
Insgesamt war es eine sehr gelungene Veranstaltung, wenn sie auch (mit meist nur 15minütigen Vorträgen und kaum Zeit für Fragen und Antworten) zum Teil etwas überdreht wirkte. Viele Bekannte aus den Mailinglisten trafen wir zum ersten Mal in Person. Das Wetter spielte auch ausgezeichnet mit – die Ortsansässigen versicherten uns, dass es auch im Juli keineswegs selbstverständlich sei, sein Bier abends im Freien trinken zu können!
Die Geofabrik-Vorträge auf der SOTM zusammengefasst:
Die meisten Beiträge wurden auf Video aufgezeichnet. Im OpenStreetMap-Wiki steht, welche schon fertig aufbereitet und herunterladbar sind.