
21.01.2026 | Michael Reichert
Today we added a new view to OSM Inspector rendering postal code boundaries.
In some regions, mappers map postcodes not only as tags on objects with an address (addr:postcode=*), but also in the form of postcode polygons.
The new view supports this endeavour by helping mappers see where postcodes are missing and where existing postcode areas overlap. As a side effect, it’s something we can show a potential customer when they come asking for “global postcode boundaries” – the view makes it clear what you can expect from OSM and what you can’t.
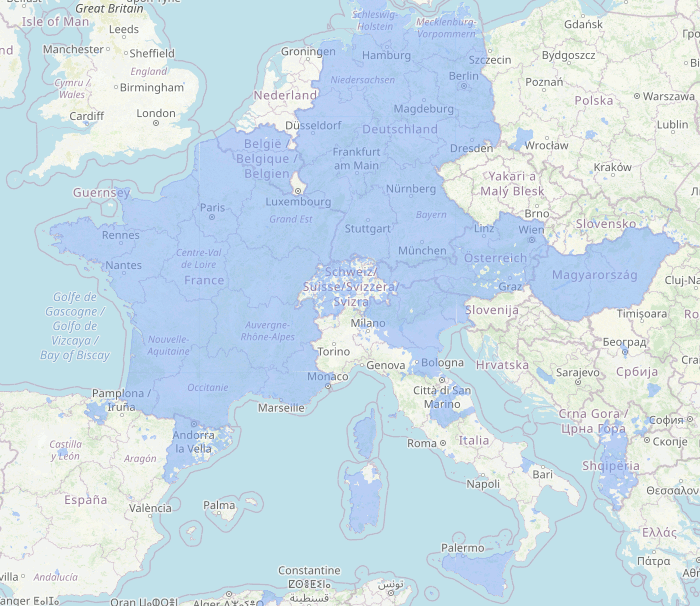
Postcode coverage is shown in semi-opaque blue. Polygons which overlap each other are yellow. Most of these are cases where both the administrative boundary and a second boundary object have a postal_code=* tag.
If postal_code=* is used on a polygon without boundary=*, it will appear as dark blue (low zoom) or orange lines (larger zoom level).
Keep in mind that OpenStreetMap primarily aims to collect ground truth. Administrative boundaries are an exception to this rule because they are considered relevant enough to include even if they cannot be observed on the ground. Post code boundaries are considered mappable in some regions and not so much in others – don’t go round adding post code boundaries in your area if the community doesn’t agree. Some countries have no postcodes at all or have postcode systems which cannot be modelled as polygons (e.g. Ireland). Therefore, there will never be a complete coverage.
The source code for the postcode view is on Codeberg.
13.01.2014 | Frederik Ramm
(Diesen Beitrag auf Deutsch lesen)
WMS servers are quite old-fashioned in many respects. The WMS specification was created in 2000, and the basics haven’t changed much – WMS essentially specifies what was then mostly a HTTP CGI request. The client says “give me this map, in this projection, for this extent, in this resolution”, and the server hands over a raster image. This is how web mapping was done before the age of tiles, or even vector data. Nonetheless, WMS is a key component in many professional GIS workflows to this day.
In fact, a long time ago when OpenStreetMap started, it did offer a WMS itself, but that was soon replaced by a tile-based map which is better suited for high-exposure situations.
At Geofabrik, we’re doing both – we have tile servers for public-facing, high-volume services, and we offer WMS for those who have different needs. We have been running our OpenStreetMap WMS for a while now (we’re selling the service starting at €35/month, see product web page). We have developed the Mapnik-based WMS server ourselves and it’s open source.
Setting up a WMS isn’t rocket science, but because the WMS needs to compute a new image for each request, you have to carefully adapt the map style and database queries to work fast enough. This is where we’ve spent quite some time optimising things, by creating suitable database indexes or computing simplified geometries for landuse areas or road networks. We’re now soft-launching our overhauled WMS, with new clients getting access to the new services and existing clients being upgraded one by one. Here’s a couple things that our WMS does:
True on-demand rendering – any projection
Every single image served by our WMS is rendered from fresh OSM data when you make the request. This means that the data you see is no older than a few minutes (apart from the simplified major roads and landuse areas used on large map scales). It also means that we will never do bitmap reprojection of pre-rendered data because the images is produced using the requested projection.

Germany in UTM32N - left, bitmap reprojection with tilted labels; right, Geofabrik WMS
If you are using other projections than the standard “Google Mercator” projection – say, UTM or Gauss-Krüger projections – then you will probably be familiar with maps where the labels are anything but straight. This happens when the WMS serves your image as a raster reprojection rather than a fresh vector rendering. It is faster but compromises image quality. We don’t do that.
High-resolution images for printing
We had offered a high-resolution “print” WMS for a while, but now we’re supporting user-set DPI so you can request a map in any resolution. Some desktop GIS systems, like Quantum GIS, will automatically re-request an image in a higher resolution if you make a printout, leading to excellent results.

Different resolutions served from the Geofabrik WMS.
Selectable layers
Because we render each image on demand, we can also switch individual layers from the OSM style on and off. This is something that we had to configure specifically for clients until now, but the new WMS uses the standard WMS layer selection methods to expose a couple of layers (like world boundaries, place names, the road network, landcover, buildings, POIs and so on). Your GIS client will let you decide which layers to request.

WMS layer selection - left, the Karlsruhe region without landuse; right, Düsseldorf without POIs
This feature is particularly useful for displaying a non-cluttered base map (e.g. without buildings and POIs). You can even use it to generate a transparent map of roads and place names for overlaying on aerial imagery.
13.01.2014 | Frederik Ramm
WMS-Server sind eine ziemlich altmodische Sache. Die WMS-Spezifikation wurde im Jahr 2000 erstellt, und viel hat sich seitdem nicht verändert: Der Client sagt “gib mir diese Karte, in dieser Projektion, für diesen Bereich, in dieser Auflösung”, und der Server schickt ein Rasterbild zurück. So lief das mit Karten im Web, bevor es Tiles oder sogar Vektorkarten gab. Nichtsdestotrotz sind WMS-Dienste auch heute noch ein wichtiger Bestandteil professioneller Arbeit im GIS-Umfeld.
In den Anfangstagen von OpenStreetMap gab es sogar für einige Zeit einen “offiziellen” Projekt-WMS, der allerdings bald durch die heutige Tile-basierte Karte ersetzt wurde, die für vielbesuchte Webseiten besser geeignet ist.
Bei der Geofabrik haben wir beides – Tileserver für öffentliche, vielbesuchte Seiten, und WMS für Nutzer mit speziellen Anforderungen. Unseren OpenStreetMap-WMS gibt es schon einige Jahre (wir bieten ihn ab €35/Monat ab, Details siehe Produktseite). Der Mapnik-basierte WMS ist eine Eigenentwicklung; der Quelltext ist Open Source.
Einen WMS aufzusetzen, ist keine Zauberei, aber weil der WMS für jede hereinkommende Anfrage ein neues Bild berechnen muss, gilt es, Kartenstil und Datenbank-Abfragen so anzupassen, dass die Antworten schnell genug kommen. Hier wir einiges an Arbeit investiert und beispielsweise spezielle Datenbank-Indizes eingerichtet oder vereinfache Geometrien für das Straßennetz und die Landnutzungsflächen berechnet. Diesen generalüberholten WMS führen wir jetzt schrittweise ein – neue Kunden erhalten gleich den neuen Server, und Bestandskunden werden einer nach dem anderen umgestellt. Hier ein paar Dinge, die unser WMS kann:
Echtes Rendern auf Anfrage – in jeder Projektion
Jedes einzelne Bild, das unser WMS herausgibt, wird aus aktuellen OSM-Daten in dem Augenblick berechnet, in dem die Anfrage hereinkommt. Das heisst, dass die Daten nie älter als ein paar Minuten sind (ausgenommen die vereinfachten Straßen und Landnutzungsflächen, die wir auf den großen Maßstäben einsetzen). Es heisst aber auch, dass wir keine Bitmap-Umprojektion vornehmen müssen, weil wir die Bilder gleich in der angeforderten Projektion ausrechnen.
Deutschland in UTM32N - links eine Bitmap-Umprojektion mit schrägen Beschriftungen, rechts der Geofabrik-WMS
Wenn Sie eine andere Projektion als die Standard-“Google Mercator” einsetzen, zum Beispiel UTM oder Gauß-Krüger, dann kennen Sie sicherlich die typischen Kartenbilder, auf denen die Beschriftungen alles mögliche sind, nur nicht waagerecht. Das passiert, wenn der WMS das Bild als Reprojektion aus vorberechneten Rasterdaten herstellt, anstatt es neu aus Vektordaten zu berechnen – es geht schneller, ist aber zum Schaden der Bildqualität. Wir tun das nicht.
Hochauflösende Bilder für den Druck
Einen hochauflösenden Druck-WMS hatten wir schon eine Weile im Angebot, aber der neue WMS unterstützt jetzt direkt benutzerdefinierte DPI, so dass die Karte in beliebiger Auflösung abgerufen werden kann. Einige Desktop-GIS-Programme, wie zum Beispiel Quantum GIS, fragen das Kartenbild für den Druck automatisch erneut in hoher Auflösung ab und bieten so ausgezeichnete Druckqualität.
Unterschiedliche Auflösungen vom Geofabrik WMS.
Wählbare Layer
Weil wir jedes Bild auf Anfrage ausrechnen, können wir auch einzelne Layer ein- und ausschalten. Bisher mussten wir das für Kunden mit Sonderanforderungen einzeln konfigurieren, aber der neue WMS benutzt dafür einfach die Standard-Layerauswahl, die im WMS-Protokoll vorgesehen ist. So lassen sich Layer wie zum Beispiel Grenzen, Ortsnamen, Straßennetz, Landnutzung, Gebäude, POIs und so weiter getrennt an- oder abwählen. Die GIS-Software zeigt i.d.R. bei der Einbindung des WMS eine Layerauswahl an.
WMS-Layerauswahl - links die Region Karlsruhe ohne Landnutzung ,rechts die Düsseldorfer Altstadt ohne POIs
Diese Funktion ist besonders nützlich, wenn man eine etwas aufgeräumtere Basiskarte (zum Beispiel ohne POIs) anzeigen möchte. Man kann sie sogar nutzen, um ein transparentes Straßen- und Ortsnamen-Overlay über ein eigenes Luftbild zu legen.
19.09.2011 | Frederik Ramm

For years, Geofabrik has been supplying the world with OpenStreetMap Shapefiles – two kinds of them, in fact; there’s our popular download page which has free shapefile downloads for many places, updated daily, and there’s our extended shapefile service where we sell shapefiles that require more work, and processing time, than the free nightly builds.
Whereas the free nightly builds are very close to the source, simply taking OSM objects and converting them into shapefiles, the extended service, which is based on a different toolchain here at Geofabrik, has a well-documented feature catalogue which we are today releasing in version 0.6 with a ton of enhancements over the previous version. The extended service also encompasses a few useful preprocessing steps, like automatically converting area POIs to points and proper handling of large multipolygons. The extended shapefiles are made to order; the standard feature catalogue contains almost anything in OSM that is widely used, but clients can also request extra features to be added. Extended shapefiles are available for any area – the whole planet, a single continent, a single country, a city, or anything in between.
In addition to releasing our new feature catalogue for our extended shapefiles, we’ve also made a change to the free nightly builds; these now have a much-asked-for “landuse” layer that contains information from OSM’s tag of the same name.
(Eine deutsche Version folgt.)
18.01.2010 | Frederik Ramm
After the recent earthquake in Haiti, OpenStreetMap contributors around the world started to do what they could to improve mapping there, tracing over satellite imagery made available by GeoEye and others. Geofabrik takes part in this effort by providing a special download server that has OSM data extracts, shape files, and Garmin maps created from OSM data, all updated every five minutes in order to put mappers’ work to maximum use. We also have very large PNG files rendered every hour, and a collection of PNG map snapshots that document how mapping has progressed:


Left, OpenStreetMap map of Port-au-Prince, 1st January, 2010. Right, same map, 17th January.
Read more about the work and results of the Humanitarian OpenStreetMap Team for Haiti.
Tell us if there is something else we can do.
1.12.2009 | Frederik Ramm

European OSM power users are already well aware of the various error checking and data analysis tools we have bundled into our OSM Inspector web application – among others, a geometry view that shows self-intersecting ways, very long ways, or very long distances between nodes in a way, and a tagging view that highlights all sorts of strange, or potentially misspelled, tags as well as anything tagged FIXME.
There’s now an additional places view showing a hierarchy of settlements and their population values.
We have been very busy improving our OSM data processing capabilities, and implementing an architecture that provides us with nightly builds of all sorts of full-planet OSM derivates. Consequently, as of today, the views mentioned above are available world-wide, and updated daily. (The remaining Europe-only layers will also be expanded to cover the whole planet – time permitting –, plus we’re working on a super cool additional multipolygon debug view to be launched RSN.)
All OSM Inspector layers have true vector data (for example, if there is a problem on a way, they will draw the whole way and pinpoint the problem). They can generate lists in addition to the map display. Direct links to JOSM and Potlatch are provided, and anyone can extract data from the WMS or WFS service to display or process in their own applications.
We have also improved the speed and usability of some of the layers, provided enhanced documentation on the OSM Inspector wiki page, (including sections detailing how you can use the OSMI layers to fix problems), and fixed some bugs.
On request of the Netherlands community, we have added a special layer for the Netherlands only that shows where work has been done since the AND import, and where things have not been touched since then.
Try it out, and tell us what you think! (Oh, and do fix some OSM bugs along the way!)
21.08.2008 | Frederik Ramm
Ich habe einen verfeinerten Satz von Bundesland-Grenzen eingespielt, den Michael Schmitt uns freundlicherweise zur Verfügung gestellt hat. Das behebt ein paar Ungenauigkeiten am Rande der von uns angebotenen OpenStreetMap-Ausschnitte und Shapefiles für Bundesländer.
5.06.2008 | Frederik Ramm
Unsere Downloadseite download.geofabrik.de bietet jetzt tagesaktuelle OpenStreetMap-Datenauszüge und Shapefiles für fast alle europäischen Länder und einige Untereinheiten (wie z.B. Bundesländer in Deutschland und einige Counties in Großbritannien).