
23.01.2017 | Frederik Ramm
We’ve just rolled out a small enhancement to the OSM extracts available on our download server, concerning the way we deal with objects that cross an extract boundary. In the last couple of years we’ve used a program called osm-history-splitter to create the extracts. This program is based on an older version of the Osmium library and is able to ensure referential integrity on the way/node level only.

Referential Integrity when making extracts. Cases a and b covered until now, case c additionally covered from now on.
The ways shown as a and b in the sketch above would have been fully contained in the extract cut our along the dotted boundary. A polygon formed by a relation c in which at least one way lies fully outside the boundary, however, would not be constructable from the extract because those ways would be missing.
We’ve now switched to the newest version of osmium, the command line companion to the libosmium library, for producing the extracts and deriving the change files. This allows us to offer referential integrity for boundary-crossing multipolygon relations, while other (non-multipolygon) relations are still handled the same as before. This is important because otherwise a large boundary or route relation crossing a small extract would blow up the size of that extract too much.
With the new complete multipolygon relations (called the “smart” strategy in osmium), the extracts we offer have seen a size increase of just 0.5% on average. Some very small extracts with lots of border-crossing multipolygons have become much larger – the Andorra extract, for example, is now three times as big as before. But we believe it is worth it! If you process nightly updates you’ll likely see a small spike today, with today’s update bringing in all those extra ways needed to complete polygons.
Using the new software has also brought down the overall processing time from around 10 hours to under 4 hours, a 60% speedup. Kudos to Jochen Topf and Mapbox for their tireless improvements to Osmium! This is a nice proof that even in times of the ever-scalable cloud, solid engineering still has its place.
29.09.2016 | Frederik Ramm
Our little band of Geofabrik people is back from this year’s State of the Map conference. Christine and Frederik, Geofabrik directors, were there as part of the SotM working group (Christine) and speaker (Frederik); Rory, a Geofabrik employee since 2014, even did two talks, and Michael, who currently writes his master thesis at Geofabrik, was a speaker too.
")
")
")
Frederik, Rory, and Michael proudly wearing their #craftmapper t-shirts
SotM started out with a really nice keynote from the US ambassador to Turkmenistan, Allan Mustard, who sounded like a proper hacker when he playfully said: “And then I realized that I was the ambassador, and all these people were working for me, and I could tell them what to do!” (and sent them mapping Ashgabat). We had overheard a few people fearing the worst: “Well, a keynote by a diplomat, that sounds tiring” – they were most positively surprised.
As always, State of the Map provided amazing insights into what goes on in the OpenStreetMap universe. The project is growing steadily, and new people bring new ideas. There are new communities, new fields of endeavour, and new technologies every year – and we were lucky enough with the weather to be able to have lunch on the landuse=grass outside!
")
")
Rory presented on vector tile work he’d been doing for Geofabrik, as well as on his long-time project of Irish townland mapping. Michael was at his best explaining the nuts and bolts of railway mapping (including exactly which places in which trains were the best spots). Frederik held forth, as he likes to do, on mechanical edits in OpenStreetMap and why he didn’t encourage them.
The social event was held at the “Event Brewery” serving nice food (including Belgian waffles) in a great atmosphere.
")
")
We all had a good time and we’d like to thank the whole SotM team for running the conference. We’re looking forward to next year. We even heard the idea of an African SotM being discussed.
")
12.08.2016 | Frederik Ramm
For years, the Geofabrik download server has been, and still is, the go-to resource for anyone wanting OSM data neatly sliced up in country or even smaller bites, and for those not into OSM tools we’ve also offered free shape files to open OSM data quickly and easily in tools like ArcGIS, QGIS and so on.
The shape files have always been “quick and dirty”, in a way, designed more for a quick preview than for serious use. We kept them simple because we wanted to be able to refresh them daily, and also because we get some income from selling more complex shape files with a fuller feature set.
One of the main shortcomings of the free shapes was that they didn’t support multipolygons – a data type that is becoming more and more frequent in OSM, being used not only for large forests but also for buildings that have a courtyard or other comparably smaller structures.
We’ve now come up with a new structure for our free shape files that is a slightly reduced version of the shape files we sell for money, but still one that has all the major objects and properties, nicely sorted into layers, and support for multipolygons.
Starting today, you’ll find “preview” links to the new shape files on our download server. We’ll keep the old files around for a while though because we know that many people are used to them. Here’s more info on the move and here’s the detailed layer description for the free shape files.
The paid shape files also receive an upgrade (from v0.6 to v0.7), covering more features and more properties than before, and also for the first time exporting routes on a separate layer. Here’s the new detailed layer description for the 0.7 shape files.
Because of the similarity between the free and paid shape files, it will now be easy for someone working with the free shapes to upgrade to the paid version if they want more features or properties, or if they need a larger area (the free shapes are only available for smaller areas).
21.04.2016 | Frederik Ramm
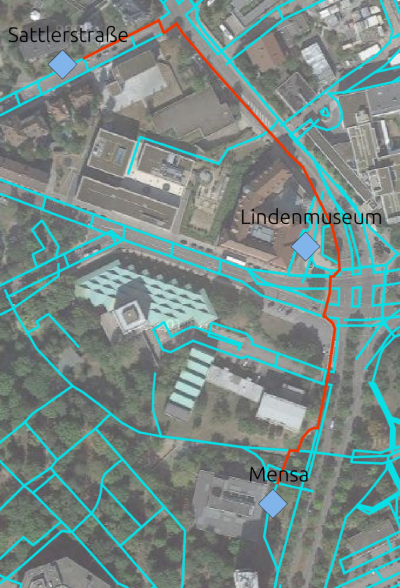
A frequent problem in OpenStreetMap is that someone dreams up a project that involves generating good routes for pedestrians, decides that OSM’s standard way of routing pedestrians along streets isn’t good enough, and proceeds to add every single pavement (or sidewalk, for our American friends) as a highway=footway – causing a headache for other mappers who now have to move three lines instead of one when they refine the road geometry, among other things.
A very promising solution to this problem has been developed by Nathanel Lang in his Bachelor Thesis (at HfT Stuttgart) available in German here: https://github.com/Nathanael-L/pedro). He’s synthesizing footways on both sides of streets (unless the highway type or particular tags say otherwise), and then takes care to properly link them to the rest of the network – or drop them again if it is found that footways have already been mapped as separate geometries. Road crossings are also synthesized because it is assumed that smaller roads may be crossed by pedestrians anywhere. That way, he can generate a pedestrian-friendly routing graph to be used as the basis for routing – without actually adding lots of unnecessary extra geometries to OSM.
The software that generates the routing graph is called “Pedro”, and available from GitHub at the URL given above. There are some open ends that might need attention before it can be used in a world-wide production environment, but already it is an excellent demonstration of the possible future of pedestrian routing with OSM.
(The thesis was mentored by Frederik Ramm at Geofabrik.)
9.02.2016 | Frederik Ramm
(Gastbeitrag von Lukas Toggenburger, der den Address-View programmiert hat)
Letzthin wurde ich von User Stephan75 wegen der Auswertung von addr:place-Tags im OSM Inspector (http://tools.geofabrik.de/osmi/?view=addresses) angeschrieben. Für die Wochenaufgabe mit postalischen Adressen hat er sich gewünscht, solche Einträge auch angezeigt zu bekommen.
Seit der ersten Version werden im OSM Inspector Verbindungslinien von Adress-Einträgen (z.B. addr:street=Bahnhofstraße) zum nächstliegenden Punkt der zugehörigen Straße (highway=residential, name=Bahnhofstraße) eingezeichnet. Falls in der Region des Adress-Eintrags keine Straße mit entsprechendem Namen gefunden werden kann, wird das als potenzieller Fehler hervorgehoben. Das Tagging-System mit addr:place=… wird für diejenigen Fälle verwendet, wo sich die Adresse nicht auf eine sich in der Nähe befindliche Straße bezieht, sondern auf einen Weiler, eine Siedlung, etc. (place=…, name=…). Der anfangs erwähnten Anfrage von Stephan75 bin ich nachgekommen: Neu werden analog den Adressen mit addr:street=… auch für die Adressen mit addr:place=… Verbindungslinien bzw. Fehlermarkierungen eingezeichnet.
Zwei weitere Funktionen habe ich ebenfalls neu eingebaut: Zum einen werden Hausnummern (addr:housenumber=…) hervorgehoben, die nicht nur aus den Zeichen 0-9, a-z und A-Z bestehen. Zum andern habe ich mir gedacht, dass Adress-Einträge (addr:*=…) auf ungeschlossenen Linienzügen (ways) wohl meistens Tagging-Fehler sind (Ausnahme addr:interpolation=…). Solche Einträge werden nun ebenfalls hervorgehoben.
Hintergrund
Im Herbst 2013 schrieb ich als Projektarbeit für mein Masterstudium im Bereich ICT die Adress-Ansicht des OSM Inspectors um. Ziel war eine schnellere Verarbeitung und die Erweiterung des dargestellten Gebiets von Europa auf die gesamte Welt. Anstatt das Projekt nach dem Erhalt der Note auf sich beruhen zu lassen, habe ich immer wieder mal Änderungen vorgenommen, einsehbar unter https://github.com/ltog/osmi-addresses.
Die Software ist in C++11 geschrieben. Unter Verwendung von libosmium (https://github.com/osmcode/libosmium) werden Adress-relevante Inhalte aus OSM-Daten extrahiert und in .sqlite-Dateien geschrieben. Deren Inhalte wiederum werden mittels OSGeo MapServer ans Webinterface ausgeliefert. Auch die direkte Einbindung in JOSM über die WMS-Schnittstelle ist möglich, siehe https://wiki.openstreetmap.org/wiki/OSM_Inspector/WxS.
Kommentare und Pull-Requests nehme ich gerne entgegen.
Ein herzliches Dankeschön geht an die Firma Geotab Inc. (http://www.geotab.com), die das Hosting des Address View finanziert und an die Geofabrik, die den OSM Inspector betreibt. Danke auch ans Institut für Photonics und ICT (http://www.htwchur.ch/ipi), das die Arbeit betreut hat (und damals wie heute mein Arbeitgeber ist).
27.01.2016 | Philip Beelmann
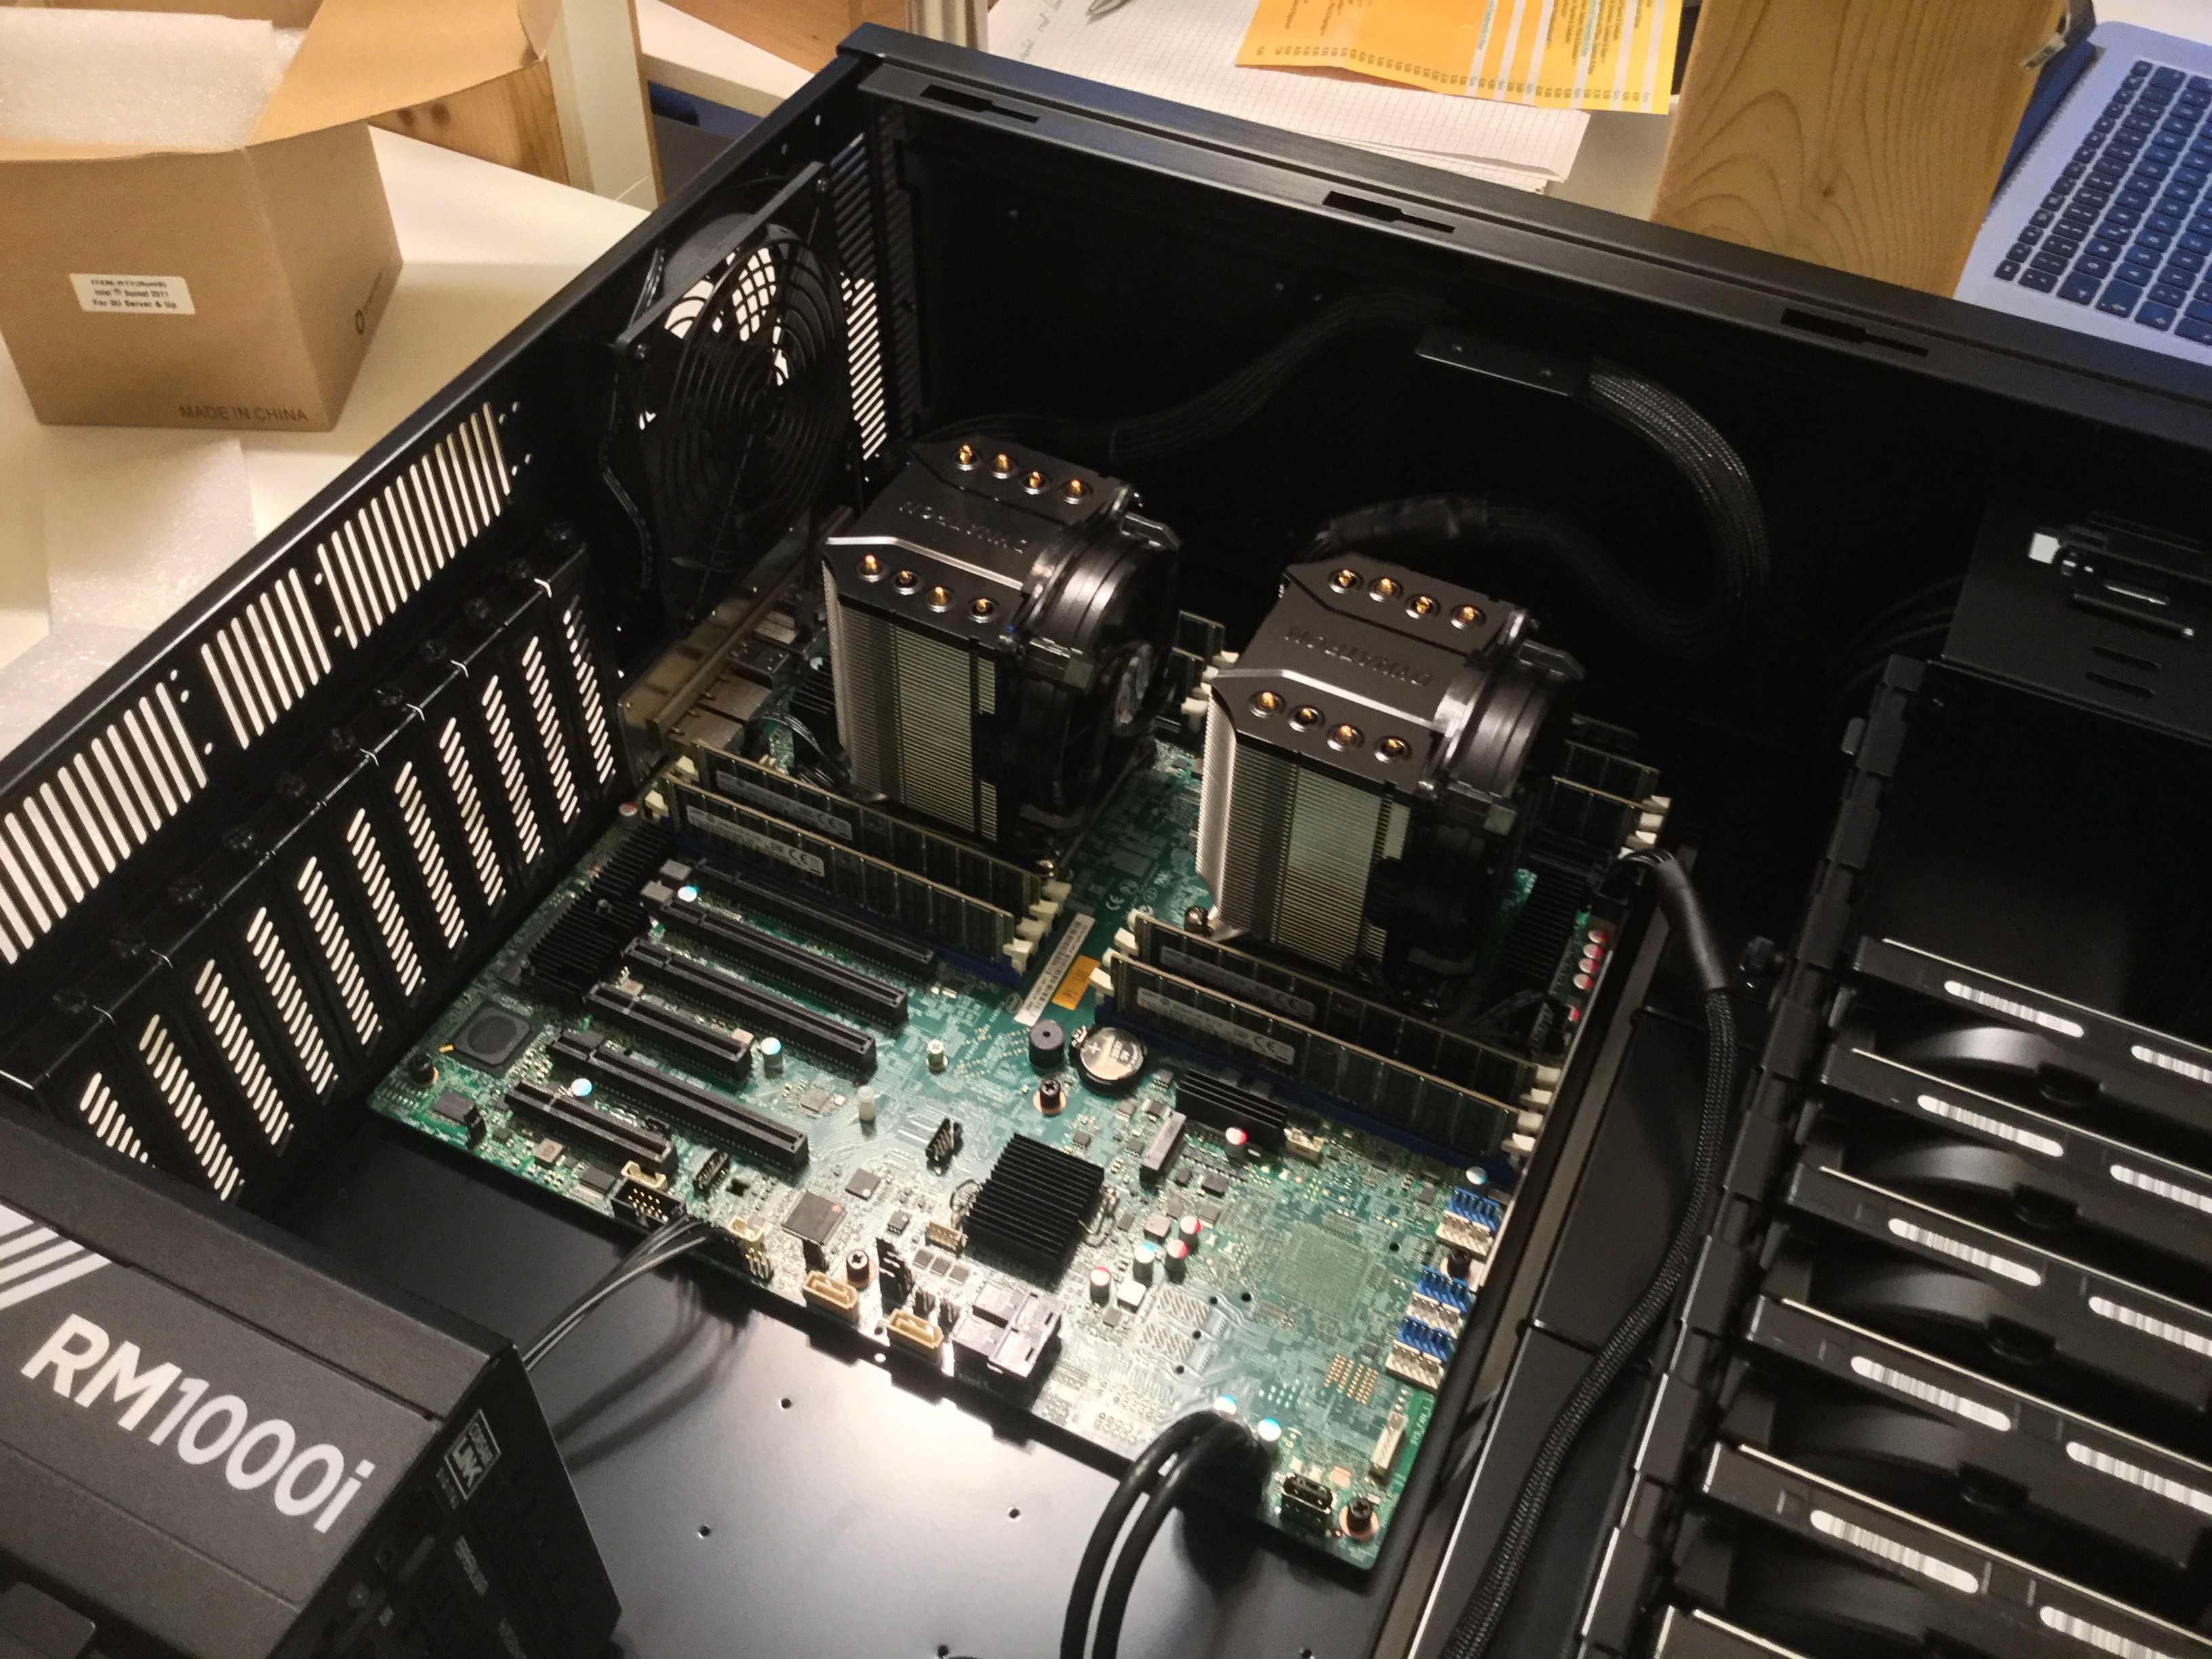
Im Dezember trafen in der Geofabrik – so wie es sich für die Weihnachtszeit gehört – nach und nach allerlei Pakete mit Hardware ein. Zu meiner Freude durfte ich die Komponenten zu unserem neuen Flaggschiff-Server zusammenbauen, der pünktlich zum Jahreswechsel in Betrieb ging.
Dank zweier Xeon E5-2623 v3 Prozessoren, 8x 32GB Arbeitsspeicher sowie 26 TB Festplattenspeicher sind wir auch für das weitere Wachstum der OSM-Daten gut gerüstet. Und das 1000-Watt-Netzteil hat auch noch ein bisschen Reserve für künftige Upgrades…


21.09.2015 | Frederik Ramm
Im Juli hat eine Studentin der Hochschule Karlsruhe, Lisa Stolz, bei der Geofabrik ihre Bachelor-Arbeit abgeschlossen. Lisa studierte Kartographie und Geomatik, und da bot sich ein gestalterisches Thema an – die “Nachtlebenkarte”.

Es gab ja schon einige Karten in dunklerem Stil oder den Versuch einer “Lichtkarte”, aber was Lisa versuchen wollte, war, diejenigen Orte, bei denen man anhand von OSM-Daten auf das Vorhandensein eines gewissen Nachtlebens schließen konnte, durch hellere und buntere Farben auch auf der Karte lebendig werden zu lassen. Dabei wurde z.B. auch von der “Kneipendichte” auf die Belebtheit einer Straße geschlossen, was sich dann in einem helleren Farbton äußerte.
Die Bachelor-Arbeit steht als PDF-Datei zur Verfügung, und der Stil kann auf GitHub unter einer freien Lizenz heruntergeladen oder abgeändert werden. Für eine begrenzte Zeit steht auch eine weltweite Demo-Ansicht zur Verfügung.
29.07.2015 | Frederik Ramm
A new, world-wide water and waterway debug layer is live at the OSM Inspector web site. We’ve done away with the old VMAP0 river reference, and extended coverage from Europe-only to the whole planet.
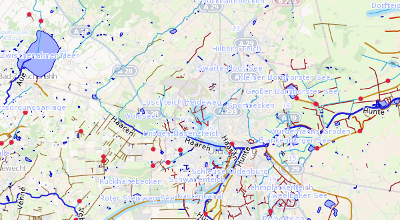
There’s tons of new features – for example, OSMI will detect when a river changes its name, or starts out of nowhere (or ends in something that is not another body of water).
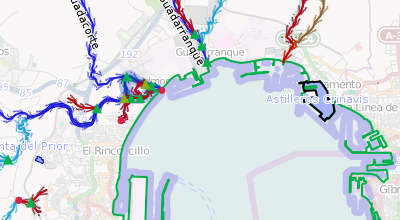
Rivers without names are highlighted, as are directional problems where two parts of a river flow towards, or away from, the same point.
The software backing these new layers has been written in C++ (using Jochen Topf’s excellent Osmium library) by Geofabrik intern Nathanael Lang. It is Free Software, and can be run in a standalone fashion to convert an OSM .pbf file into a SQLite database if you’d like to run your own analyses. Fork it, or report issues, on GitHub!
11.04.2014 | Frederik Ramm
For over 5 years now, Geofabrik’s OSM Inspector is an important quality assurance tool for OpenStreetMap, used by thousands of mappers on a daily basis to check their local area or their own work.
Some of the Inspector’s layers, like for example the routing problem analysis or the broken multipolygon view, have already been available world-wide for a while; but others were restricted to Europe because of limited resources.
Today we announce the launch of a world-wide address layer, highlighting mistyped addresses, addresses without matching roads, bad interpolation ranges, and other common problems with addresses in OpenStreetMap. The new view is available from the standard view select drop-down in OSM Inspector, replacing the previous Europe-only layer.

This view was previously computed by a relatively slow process based on a PostGIS backend, and now uses a completely new standalone backend that is based on Jochen Topf’s new Osmium library, and available on GitHub.
![]() This launch is made possible by a generous hardware sponsorship from Canadian telematics company Geotab Inc. – thank you!
This launch is made possible by a generous hardware sponsorship from Canadian telematics company Geotab Inc. – thank you!
We’d also like to thank Lukas Toggenburger, who developed the new OSMI address backend as part of a project thesis for his master studies at HTW Chur, in Switzerland, in a cooperation with HSR Rapperswil.
11.02.2014 | Frederik Ramm
The OpenStreetMap Foundation is an English non-profit organisation created to support the OpenStreetMap project. It has about 500 individual members. The Foundation pays for the servers on which OSM is run, organises the yearly “State of the Map” conference, and last not least also has to deal with the legal aspects of running a world-wide, crowd-sourced mapping project. Foundation work is done by volunteers entirely (one of which is this author), but of course money is needed for hardware and hosting, accounting, legal fees, and various bits and pieces that help the volunteers do their jobs.
Since the Foundation’s last Annual General Meeting in September 2013, the Foundation is open to corporate members.
You can now be among the first who publicly show their support for the OpenStreetMap project by signing up as a corporate OSMF member. The membership fee is £1,000 per year (at current rates, that’s €1,200 and US$1,650). Your membership fees will help to keep OpenStreetMap’s servers running and ensure the continued success of the project.
Read more on the OSM Foundation blog.
Geofabrik, of course, has joined already, and we encourage our friends and clients to do likewise.